Crypto Market Analysis: Key Statistics, Price Trends and Trading Data
Explore crypto market statistics, price trends, and trading data insights. Understand market behavior effectively.
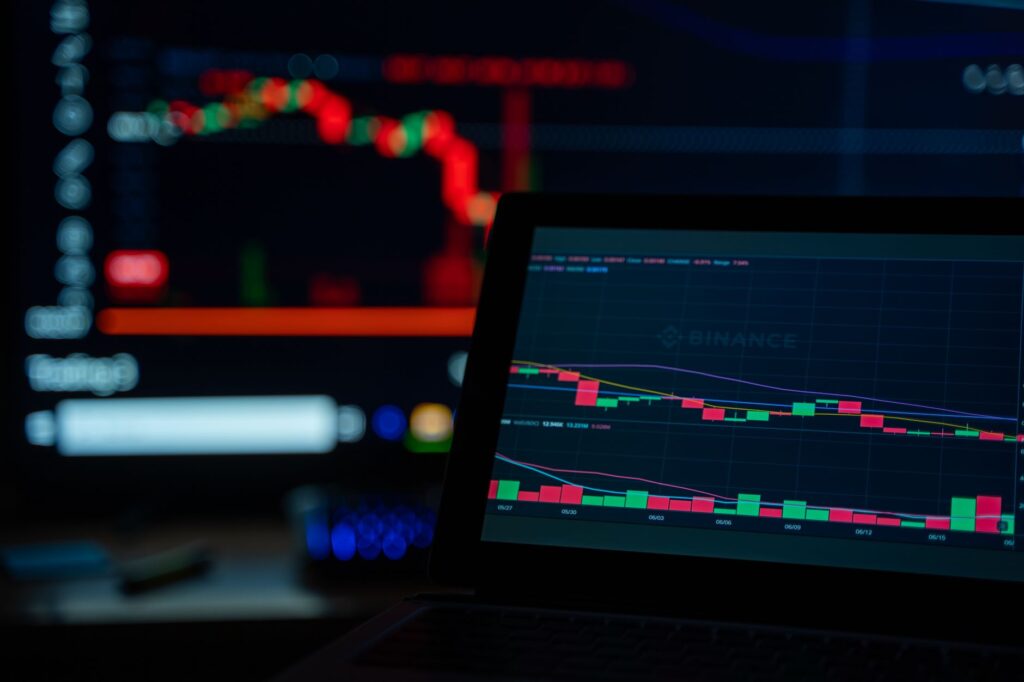
Digital assets have created a data-rich financial market where price movements can be measured across multiple timeframes and trading environments. crypto markets generate continuous streams of numerical information, including price changes, trading volume, market capitalization, volatility, and historical performance. For traders and market researchers, these statistics provide a practical foundation for studying digital-asset behavior and developing a more organized approach to market analysis.
Contents
- Understanding Crypto Market Statistics
- The Importance of Market Capitalization
- Measuring Daily Price Performance
- Examining Trading Volume
- Understanding Crypto Volatility
- Using Timeframes for Better Analysis
- Tracking Historical Highs and Lows
- Building a Personal Crypto Data Journal
- Combining Several Data Points
- Creating a Consistent Research Framework
- Conclusion
Understanding Crypto Market Statistics
Statistics help turn continuous market activity into information that can be compared and reviewed. Price performance, percentage changes, trading volume, and market capitalization are among the key measurements frequently examined in digital-asset markets.
Tracking these figures over time can help create a clearer picture of how individual assets behave. A consistent statistical record also makes it easier to compare different market periods.
The Importance of Market Capitalization
Market capitalization provides an estimate of the total value assigned to a digital asset based on its circulating supply and market price. It is a useful measurement when reviewing the relative scale of different assets.
Changes in market capitalization can be monitored alongside price performance to understand how the overall valuation of an asset changes. This makes it a valuable figure for broader market research.
Measuring Daily Price Performance
Daily performance statistics provide a straightforward way to examine market movement. Traders can observe opening and closing prices, daily highs and lows, and percentage changes.
Recording these figures across multiple sessions creates a historical dataset. This information can then be used to compare periods of stronger movement with periods of more stable price behavior.
Examining Trading Volume
Trading volume measures the amount of an asset exchanged during a specific period. It can provide useful context when studying price activity.
Comparing volume with price changes creates a broader statistical picture. For example, traders can observe whether periods of significant price movement also correspond with changes in trading activity.
Understanding Crypto Volatility
Volatility is an important characteristic of digital-asset markets. It describes the degree of price fluctuation within a selected timeframe.
Historical volatility measurements can help traders understand the range of movement associated with particular assets. Comparing volatility across different periods can also provide valuable information about changing market conditions.
Using Timeframes for Better Analysis
Digital-asset markets can be examined across minutes, hours, days, weeks, and longer periods. Each timeframe provides a different statistical perspective.
Shorter intervals can highlight immediate price fluctuations, while longer periods can reveal broader trends and historical development. Reviewing several timeframes together can create a more complete market profile.
Tracking Historical Highs and Lows
Historical price levels provide useful reference points for statistical research. Traders can record previous highs, lows, average prices, and percentage movements to understand an asset’s development over time.
These measurements can be organized into charts or trading journals, creating a practical record for future market analysis.
Building a Personal Crypto Data Journal
A personal journal can turn daily observations into meaningful statistics. Traders may record entry and exit information, price movements, trading volume, market conditions, and observations about their research process.
Regularly reviewing this information can help identify recurring patterns within personal trading activity and create a more disciplined approach to market research.
Combining Several Data Points
No single statistic provides a complete description of a digital asset. Price, volume, volatility, market capitalization, and historical performance each provide a different perspective.
Combining these measurements allows traders to develop a more comprehensive view of market activity. A multi-factor approach can also make research more structured and informative.
Creating a Consistent Research Framework
A statistics-focused approach works best when measurements are collected consistently. Traders can select the figures most relevant to their objectives and review them at regular intervals.
Maintaining the same measurement framework makes comparisons easier and creates a reliable record of market observations. Over time, this process can support a professional and data-oriented research routine.
Conclusion
Crypto markets offer extensive opportunities for statistical observation through price performance, trading volume, market capitalization, volatility, and historical data. By organizing these measurements across different timeframes and maintaining consistent records, traders can develop a detailed understanding of digital-asset market behavior. A disciplined focus on measurable information provides a practical foundation for professional market research and a more structured approach to studying evolving digital markets.
The Short Version
- Digital assets generate continuous streams of numerical information, including price changes, trading volume, market capitalization, volatility, and historical performance.
- Market capitalization estimates the total value assigned to a digital asset based on its circulating supply and market price, serving as a useful measurement for relative asset comparison.
- Daily performance statistics enable traders to observe opening and closing prices, daily highs and lows, and percentage changes, creating a historical dataset for analysis.
- Volatility describes the degree of price fluctuation within a selected timeframe, and monitoring historical volatility can provide insights into changing market conditions.
- Different timeframes in digital-asset markets yield varying statistical perspectives, allowing for a comprehensive analysis of immediate fluctuations and broader market trends.
- A personal crypto data journal can help traders systematically track their observations, enabling them to identify recurring patterns and adopt a disciplined research approach.